


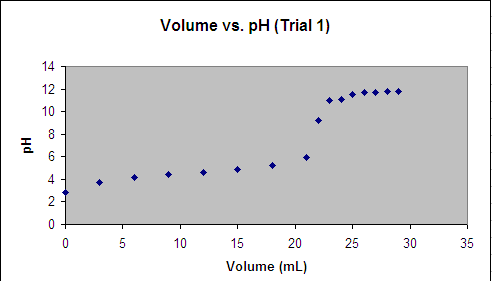
Alright, I need help figuring out what to do on my chem lab. The experiment required us to do a titration of a weak acid w/ a strong base and now we need to estimate the equivalence point. I plotted the data in excel and this is what i get...
Now, my lab TA said that when you figure out the equation to the graph, take the first derivative of the equation, plot the new eq. and the tip of the curve will be the equivalence point. I realized I dont know how to figure out the equation so I emailed her and she sent me this link:
http://www.uky.edu/~holler/che226/titrations/titration_curve.html#data
I cant make any sense out of it...so I figured someone here might have some experience in this field.
Thanks
+ Reply to Thread
Results 1 to 6 of 6
-
-
Dont figure out the formula for the graph just follow the example on the differntiate page (click on bottom of page in link to get the differentiate section)
This is the link for the file
http://www.uky.edu/~holler/download/acid_base_curve_fit.xls
1. Take the value for each point and fill in each spot on the spreadsheet that corresponds from the example above
Ex your first point is ~ vol=0, ph=2.3
point 2 is vol=2.6, ph=3.9.......
Last point vol=29, ph=12
Then copy and paste the formulas and the values will fill in automatically to make your first derivative graph automatically for the rest of the values DV(change in V), Dph(change in ph), Vavg....ect ect
The spiked point will be your equivalence value -
Sweet...I'm blind and didnt see the differentiate thing on the spreadsheet. Thanks man
-
I would've put the values in my calculator gotten a cubic regression equation and taken the derivative of that and gotten the derivatives y values with the listed x values .
-
Yep that would have worked fine he just had that perfect example there I figured it would be easy to use thatOriginally Posted by eag182
-
Thats what I did in lab while we were doing the experiment to see if i was doing ok but the experiment required us to excel and the lab report wanted a printed graph of all 3 trials. The chem dept at my school is really anal about every little thing so it has to be "perfect".Originally Posted by eag182
 Quote
QuoteSimilar Threads
-
Excel basic question
By alintatoc in forum ComputerReplies: 2Last Post: 8th Dec 2011, 09:46 -
How to activate macro's in Excel 2007 with a spreadsheet from Excel 97
By blinky88 in forum ComputerReplies: 3Last Post: 11th Feb 2009, 12:21 -
Subtitle question for PS3 owners and experts....
By siratfus in forum SubtitleReplies: 1Last Post: 26th Jul 2008, 00:27 -
Quick Question
By Scryer_360 in forum Newbie / General discussionsReplies: 3Last Post: 26th Dec 2007, 08:21 -
This Is A Loaded Question For You Video/Audio Experts Out There...
By pmolson in forum Newbie / General discussionsReplies: 2Last Post: 20th May 2007, 14:32