
+ Reply to Thread

Results 1 to 9 of 9
-
I'm guessing what you are looking at are various title and action-safe area markings, however taken out of context it's hard to be certain. Where did it come from ?
Read my blog here.
-
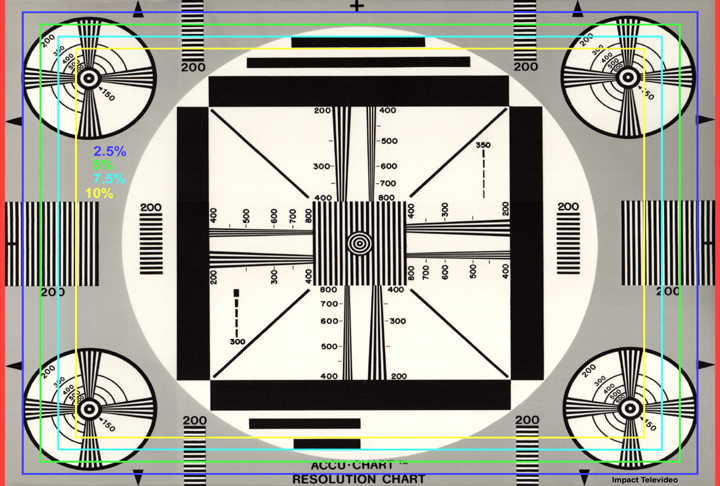
This looks like the standard Resolution chart we used to use to test the resolution of camera lens. The added color lines are for different things,
i.e scanners, copiers, etc. Take the original place on wall, photograph it with camera, video or still. process or play back the image. The point where the lines start to blur and become unreadable that is the general resolution for that lens. Copies do not work because it induces faults for the copying device. They used to publish these charts in the photography
magazines to show various lens comparisons. -
The colored lines are to indicate how much overscan your display (TV) has.
-
You can also use that chart to see if there is any pincushion or other bending on lines plus black level and color fringing.
I think,therefore i am a hamster. -
That is the EIA resolution chart used to evaluate a television camera. You need to put the arrows on the edge of the underscanned viewfinder image for the chart to be meaningful.
This chart is mainly used for resolution measurement in "lines" as perceived by the human eye from a broadcast spec monitor.
The overlay lines are not part of the test chart. Presumably they were added for safe action and safe title but these are not standard. I guess they were added to measure monitor overscan. -
Member

- Aug 2001
- Kennesaw, GA - USA

, PC 3200
PNY GeForce FX 5500 AGP 8x
Pinnacle PCTV Pro
Pioneer DV563A-S
Sony DRU500a
ECS 848P-A")

The circles are helpful for determining proper aspect ratio on the display. For instance, if they are tall ovals, you need to either widen the picture or shorten it verticalally.
You can use the colored lines to see how much overscan you have. You can also use the colored lines to properly center your image.
The points on the arrows are helpful in determining if you are seeing the whole picture.
Not sure about this, but I am guessing the numbers 200 and so forth are for judging resolution. For instance, if you can see spaces between the lines, then you have at least 200 ppi... and so on.
Darryl -
Thanks guys. I am hoping to use this (or something like it) to test my capture rig and VCRs.
-
example of using chart to test a TRV-900
http://www.bealecorner.com/trv900/respat/

 Quote
QuoteSimilar Threads
-
A C++ Program to read in YUV frame at QCIF (176x144) resolution
By yoursclark in forum Newbie / General discussionsReplies: 0Last Post: 29th Jul 2010, 03:55 -
Taiyo Yuden to JVC Conversion Chart
By Xscream in forum MediaReplies: 12Last Post: 30th Oct 2009, 08:11 -
Comparison Chart of Over 40 HD Cameras
By Gary Roberts in forum DVB / IPTVReplies: 0Last Post: 17th Dec 2008, 09:32 -
How to read the resolution of video via API?
By jsdf in forum ProgrammingReplies: 2Last Post: 12th Mar 2008, 07:45 -
freeware organizational chart maker?
By lordsmurf in forum ComputerReplies: 3Last Post: 19th Feb 2008, 23:57